Did you want to have a strategy on the cloud that monitors the market and updates you on new Buy/Sell signals (as well as number of shares, etc) by email. Did you want to run it on best of breed "always ON" servers with free and accurate data?
How much would that set you back?Well, Nada! Courtesy of Google.This post will guide you through coding a simple Tactical Asset Allocation on Google's Docs.
You need:
1. A Google account.
2. Google Docs.The system is similar to Faber's TAA model using 5 Etfs.: SPY,TLT,VNQ,EEM,DBC
We buy or sell at the beginning of the month ONLY.
If Close > 200-moving Average then we buy the ETF.
If Close < 200-moving Average then we sell the ETF. Pseudo Code: If TodayIsNewMonth AND CloseETF>MA(200) Then Buy
If TodayIsNewMonth AND CloseETFScript Editor...
This should open a new script Editor. Select "SpreadSheet" as your project.
Lets start coding.
Google Docs scripting uses a version of JavaScript which seems fairly easy for non programmers.
It would be nice to create an object that holds all the ETF information.
So here's the function to store each ETF's info:
function tickerobj(symbol,close,action,posscore,sma) {//tickerobj("SPY",154,1,20,150)this.symbol=symbol;this.close=close;this.action=action;this.posscore=posscore;this.sma=sma;}
How do we retrieve data from Google?
function myGetHistoricalStockInfo(symbol,days){var start=newDate();var finish=newDate(); start.setDate(finish.getDate()-days); finish.setDate(finish.getDate());var data = FinanceApp.getHistoricalStockInfo(symbol, start, finish, 1 );if(data==undefined)return(0);elsereturn data;}
We need to calculate the Simple Moving Average from the Data to check if close>sma(200).
function SMA(data,period){//data is a FinanceApp.getHistoricalStockInfo object arrayvar end=data.stockInfo.length-1;var close=[];var sum=0;var count=0;for (var i=end;i>end-period;i--) { sum += data.stockInfo[i].close; count++; }return (sum/period);}
How do we know it's the beginning of the month?
function NewMonth(){var now=newDate();var yesterday=newDate(); yesterday.setDate(now.getDate()-1);if(now.getMonth()!=yesterday.getMonth())return (1);elsereturn (0);}
So let's start calculating and storing info for each ETF. Tickerlist would be "SPY,EEM,...etc".
function CreateInstr(tickerlist,SMAperiod){var symbolarray=[];//split tickerlist by comma (",") symbolarray= tickerlist.split(",");//how many symbols in the listvar idx=symbolarray.length;var close=[];var smat=[];var posscore=[];var action=[];//var symbol=[];var Instrument=[]; var idx1; var data=[];//Go through each symbol. I.e. SPY...then EEM...for (var i=0;i<idx;i++) { //get hist data data=myGetHistoricalStockInfo(symbolarray[i],SMAperiod*2);//get index of the last data point idx1=data.stockInfo.length-1;//get the last closing price close[i]=data.stockInfo[idx1].close;//get the moving average smat[i] = SMA(data, SMAperiod);//not used in this example posscore[i]=0;//action - If close>mov. average, 1(buy) otherwise -1(sell) action[i]=(close[i]>smat[i])?1:-1 ; //Now store all the infor in the object Instrument[i]=new tickerobj(symbolarray[i],close[i],action[i],posscore[i],smat[i]); }return(Instrument);}
So let's show all this info on the Spreadsheet.
function ShowTAAOnSpreadsheet(){var sheet = SpreadsheetApp.getActiveSheet();var date=newDate();//You may use your own ticker list and periodvar Instrument=CreateInstr("TLT,SPY,EEM,VNQ,DBC",200);//Set the Name headers for each column sheet.getRange(3,1).setValue("Symbol"); sheet.getRange(3,2).setValue("Close"); sheet.getRange(3,3).setValue("SMA"); sheet.getRange(3,4).setValue("Action");var idx=Instrument.length;for (var i=0;i<idx;i++) { sheet.getRange(5+i,1).setValue(Instrument[i].symbol); sheet.getRange(5+i,2).setValue(Instrument[i].close); sheet.getRange(5+i,3).setValue(Instrument[i].sma); sheet.getRange(5+i,4).setValue(Instrument[i].action); } sheet.getRange(1,1).setValue("Last Update"); sheet.getRange(1,2).setValue(date);}
Now you can go on the top Menu and select a function to run. Select "ShowTAAOnSpreadsheet".Press the "paly" button to run.
Go to the spreadsheet, see if it updated.
Last is a function to email ourselves the results. We should schedule this to run everyday (Menu-->Resources-->Current project's Triggers).
Please do not abuse Google's Servers by having it run too often. They are kind enough to provide this kind of functionality free of charge.
function EmailPositions(){//if not new month do not calculate or email anything, just exit with 0. if (NewMonth()==0)return (0);var email = Session.getActiveUser().getEmail(); var Instrument=CreateInstr("TLT,SPY,EEM,VNQ,DBC",200);var idx=Instrument.length;var txt="";for (var i=0;i<idx;i++) { txt=txt+Instrument[i].symbol+","+" Action: "+Instrument[i].action+"n"; } MailApp.sendEmail(email, "TAA_5_FromGoogleDocs", txt);}
You can easily customize the code to your needs. For example it should be fairly easy to calculate risk parity allocations weights and have them emailed to you.
Again, please do not abuse Google's servers. Let's keep this functionality free.
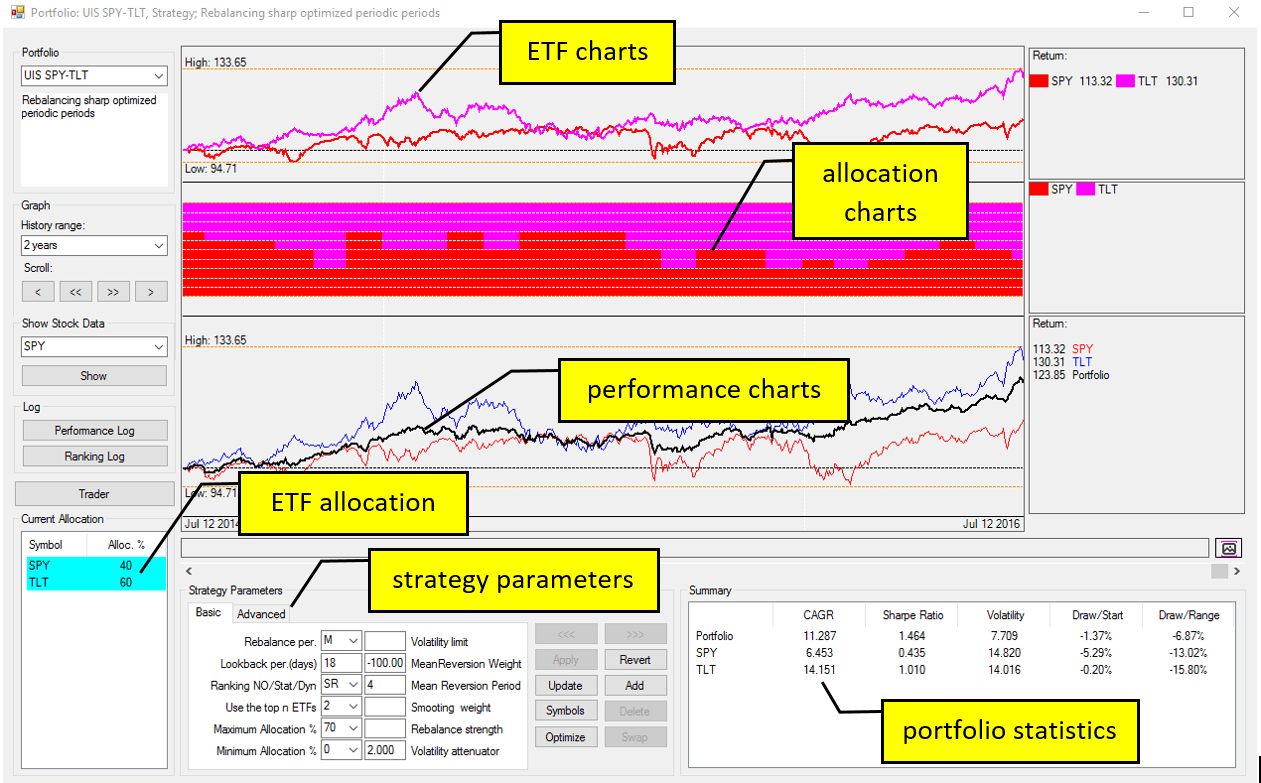
Investment software to easily create and backtest a rules-based investment strategy
QUANTtrader is a swiss-made software tool used to develop, backtest and implement rules-based strategies. It was initially developed by Frank Grossmann as his personal investment software. After having sold two companies, Frank trades for a living and his software reflects this. QuantTrader is available from Logical-Invest.com for a monthly license.
Since it is built by a trader and long-time investor rather than by a developer. QuantTrader's main strength is in building medium to long term investment portfolios that are diverse, adaptive and can control risk. All this without writing a single line of code.